Free for All
Common Mistakes in Measuring Retention: N-Day vs. Rolling Retention
Jun 13, 2024
5 min
Retention measures how many users return to your product over time. It’s a key metric for predicting whether your product has product/market fit. The more often users come back to your product, the higher the likelihood they find value in it.
To measure retention correctly, it is critical to understand the difference between these two types of measurement methods:
Rolling retention
N-day retention
Let's Start with Rolling Retention
Rolling retention measures the percentage of users who return at least once within a specific period, like 30 or 90 days. While this can look impressive, it can be misleading for high-frequency usage products.
A common mistake is measuring and reporting retention on a rolling basis for high-frequency usage products, such as social apps or games. This can inflate your retention numbers and lead to misinformed decisions:
Rolling retention includes any return within the period, not just specific days, making it seem like more users are engaged than actually are.
Problem #1: For example, if you have a food delivery app and expect people to order food every weekend, measuring rolling retention will always show higher numbers since it will include users who ordered in week 4, even if they didn’t use the app in weeks 1, 2, and 3.
Problem #2: You might wrongly assume that your product delivers mid-term value when users actually had long gaps between uses.
Problem #3: As a result, your retention metric will fluctuate and show higher numbers.
Good news! Your investors and stakeholders might be pleased with high rolling retention numbers. However, this doesn’t effectively represent that your product delivers consistent value, as it should make users return every week.
How To Measure Retention
1. Understand Your Product’s Natural Usage Frequency
When measuring retention, it’s crucial to understand how often users are naturally expected to use your product. This varies significantly based on the type of product.
Daily Use: For products like social media apps, users are expected to engage daily.
Weekly Use: For products like food delivery apps, users might be expected to order weekly.
Monthly Use: For subscription-based products, users might interact once a month.
Adjust your retention measurement to align with this natural frequency for an accurate picture of user engagement.
2. Use N-Day Retention
N-Day retention measures the percentage of users who return on specific days after their first use (e.g., Day 1, Day 7). This provides a clearer picture of user engagement at key intervals.
For example, using our food delivery app, N-Day retention will show the percentage of users who returned to order food on specific weeks. It will reveal if users ordered in week 1 and week 2 but not in week 3, indicating a drop-off in engagement.
You can then strategize to send push notifications or discount coupons to encourage users to return in week 3, improving retention.
Deep Dive: Analyzing Food Delivery App Retention
Measure Retention on a Rolling Basis
Consider a food delivery app expecting weekly orders. If you only look at rolling retention over 3 the months period, you might see a high percentage of users returning at least once in that period. However, this can be misleading:
Let’s say, on Feb 27th week, 1969 users signed up in our Food Delivery App. Measuring their weekly retention into a purchase (event "'Purchase Completed”) on a rolling basis will show us a following trend:
Week 1: 53% of users made a purchase (including users who did not return on Week 0, but returned on Week 1)
Week 2: 51% of users made a purchase (including users who did not return on Week 0, 1, but returned on Week 2)
Week 3: 49% of users made a purchase (including users who did not return on Week 0, 1, 2 but returned on Week 3).
As you can see on the graph below, rolling retention measures all users who have returned at any point up to and including each week, leading to higher percentages as it accumulates more users over time.
It can be useful in understanding overall engagement over time, but less practical in indicating drop-offs more proactively.

[Retention report measured as “on or after” (i.e rolling) in the Mixpanel]
Measure as N-Day Retention
Despite high rolling retention, your weekly user engagement might be dropping. N-Day retention helps pinpoint these drop-offs, showing you need to improve early retention (see the graph below).
For example, for the same Week 3, n-day retention only counts the 189 users who returned that week (7.54%), contrary to rolling retention, which includes all users who have returned at any point up to and including Week 3 (50.9%).

[Retention report measured as “on” (i.e N-Day retention) in the Mixpanel]
N-Day retention helps identify when users are most likely to drop off. This allows you to pinpoint critical periods where interventions are needed.
For example, on the graph above, Week 0 and Week 1 show a significant drop. Your food delivery app loses approximately 93% of new users, minimizing the likelihood that they will come back. In this case, you might consider improving your onboarding or implementing targeted re-engagement campaigns, such as push notifications or special offers, to encourage users to return and make a purchase.
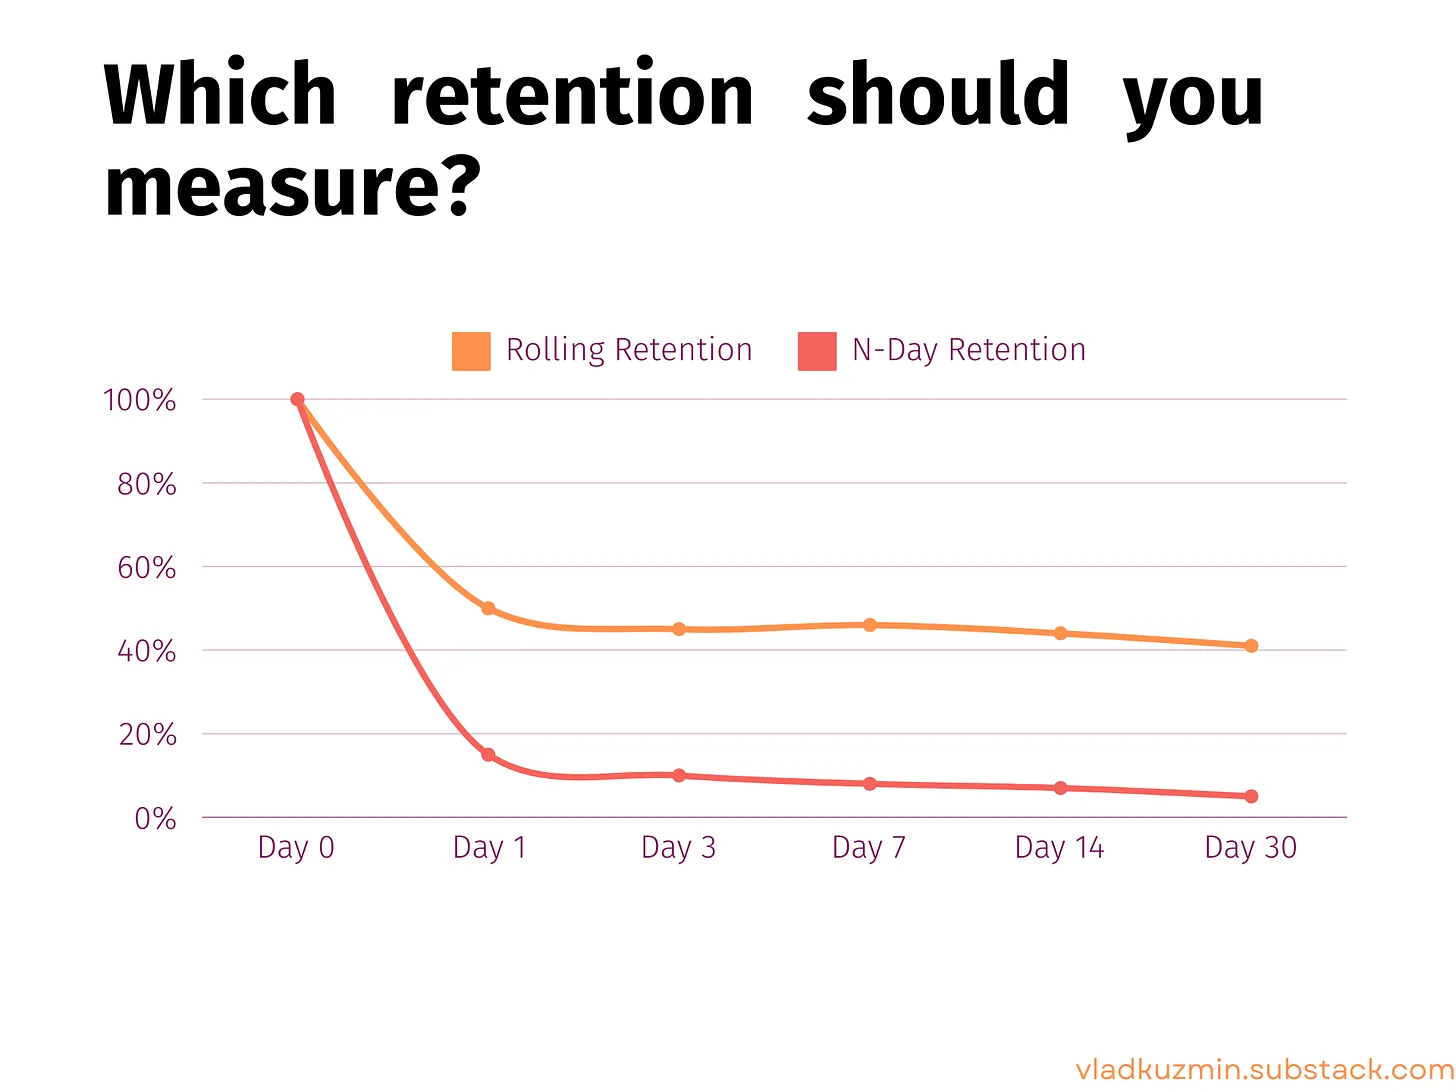
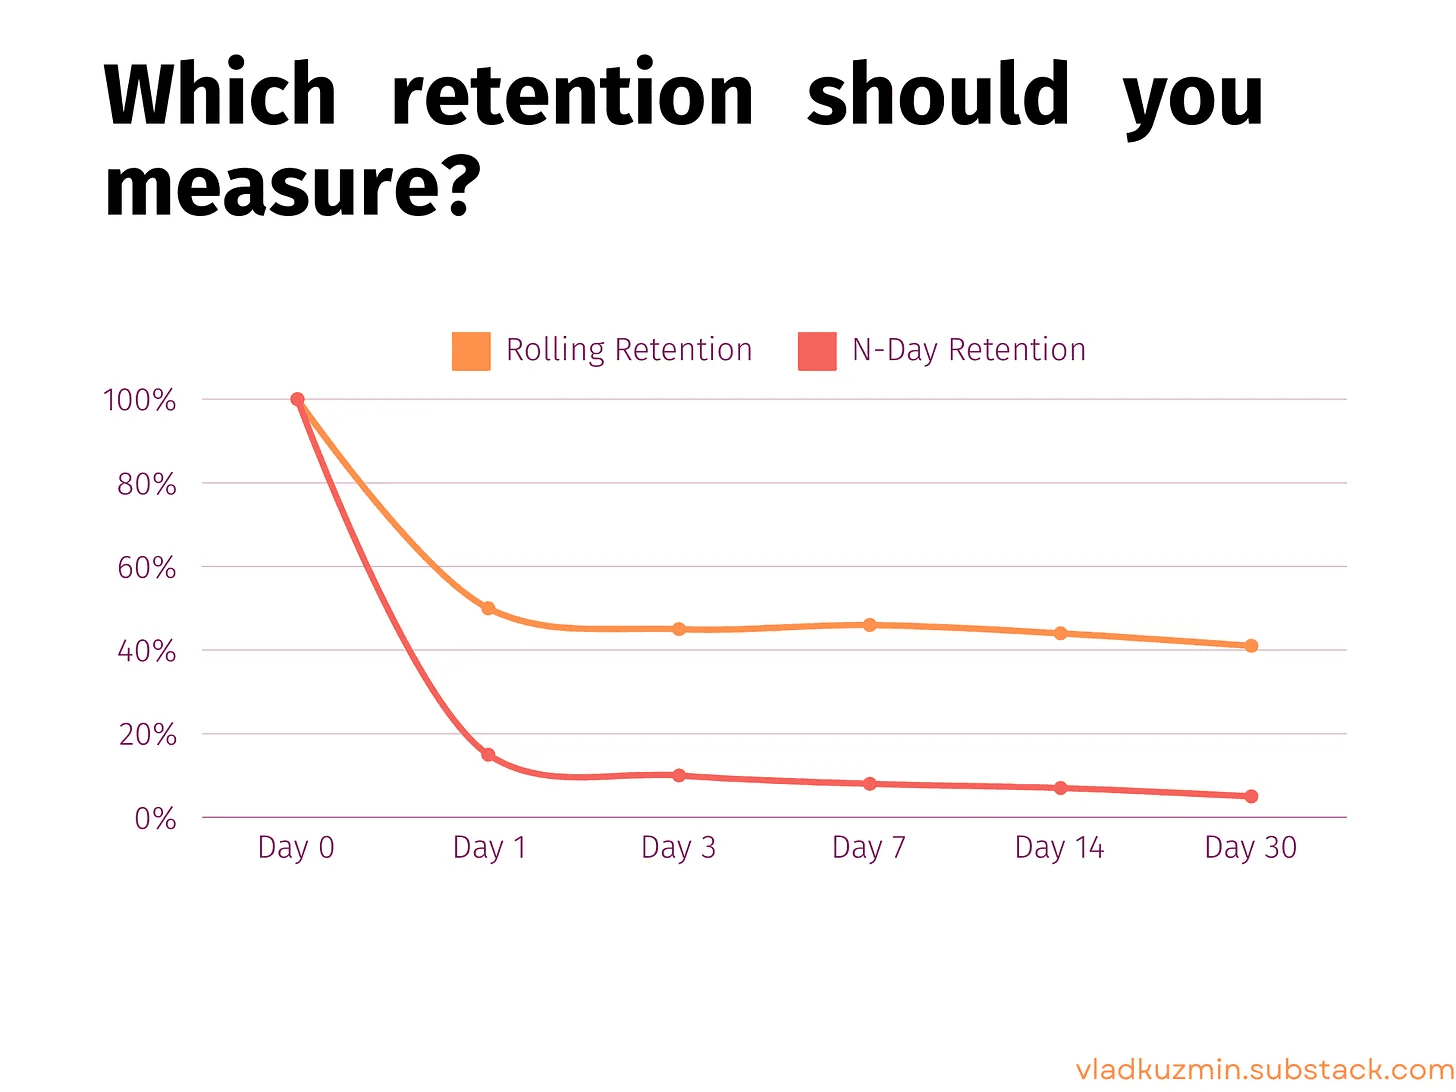
Wrap-Up: Choosing Between Rolling Retention and N-Day Retention
Using the right retention measurement method helps accurately understand user engagement. Rolling retention offers a broad, cumulative view, while N-Day retention provides detailed insights into specific behaviors. Combining both methods enhances your ability to improve user retention effectively.
Rolling Retention
Best For:
Overall Engagement Over Time: Broad view of long-term user engagement.
Cumulative Tracking: Ideal for products with less frequent usage patterns.
N-Day Retention
By using N-Day retention and aligning metrics with your product’s natural usage frequency, you can provide a clear, honest view of your product’s performance and make informed decisions to boost retention.
Best For:
Specific Period Analysis: Clear picture of user engagement on specific days.
Identifying Drop-Off Points: Pinpoints when users drop off for targeted interventions.
Tips
Understand Usage Frequency: Align your retention measurement with how often your product is used (daily, weekly, monthly).
Use Both Methods: Combine rolling retention for overall trends and N-Day retention for detailed behavior analysis.
Accurate retention tracking is essential for truly understanding user engagement and product value. By using N-Day retention and aligning metrics with your product’s natural usage frequency, you can provide a clear, honest view of your product’s performance and make informed decisions to boost retention.
Recommended Reading
If you want to dive deeper into this topic, here's top-3 resources that I recommend:
Why N Day Retention is the Metric that Matters for Mobile Games
Why Does Knowing Your User Retention Rate Matter
Get More Insights Like These
Join my newsletter for straightforward tips on doing better work like that. No fluff, just actionable advice.